Technical analysis of stocks is a complicated jargon for stock market beginners. This is a strategy to predict the future price of stocks after checking the past and current price movement action of the stock. Technical analysis reveals a stock’s strength and weakness and hints future changes in price whether upward or downward. The change of price of a stock is a constant matter and the change in price is influenced by a variety of economic, monetary, political and psychological forces. In other words the impact of these external forces or news will quickly show in a form of price movement either upwards or downwards. Technical analysis of stocks focuses on what is happening instead of why it is happening. Pure technical analysts are concerned about the trends implied by the past date price movements in the charts, indicators etc.
How to do Technical Analysis of Stocks
Technical analysis of stocks is done by following components:
Charts, price behaviour in the past.
Analysis due to the news and making assumption of the news to predict future price change either upward or downward.
Concentrate on stop loss, support, resistance, MACD Charts.
Charts, price behaviour in the past
First of allanalyse the charts of a stock carefully. Price behaviour means how a stock’s value goes ups and downs for the whole years and these ups and downs are depicted in a chart. Suppose a company has performed well and given stellar performance due to strong sales on the occasion of Dhanteras or Dewali as it offers discounts on its products. In this festive season the sale of the company increases leading to a good profit margin for the company.
It is seen that every year the company gains huge profit in that specific quarter due to increased sales. Consequently, after quarterly results the company’s share price spikes from 12%-17% in a single day. Sometimes later, the stock does not move upward so much. This is the stock’s price behaviour. This price behaviour is depicted in a chart. Obviously it is a smart act to buy the specific stock just before that festive season or it announces its quarterly results. When the stock’s price spikes up at the time of festive season or after the quarterly results, then you should book the profit and earn a satisfactory return.
Analyse the news you receive from different sources. Suppose weather department forecasts there will be a normal monsoon this year. Just use your intelligence here. Good monsoon means good agricultural productivity. Consequently, farmers associated with agriculture will get fair price of their agricultural product and this will increase their purchasing power. The increased purchase power of farmers will create higher rural demand and there will be more money flow in the economy. The direct beneficiaries for this situation will be FMCG, Auto companies i.e., two wheeler companies etc. So as an investor of these sectors you may be profited.
Analyse Support, Resistance & Stop loss
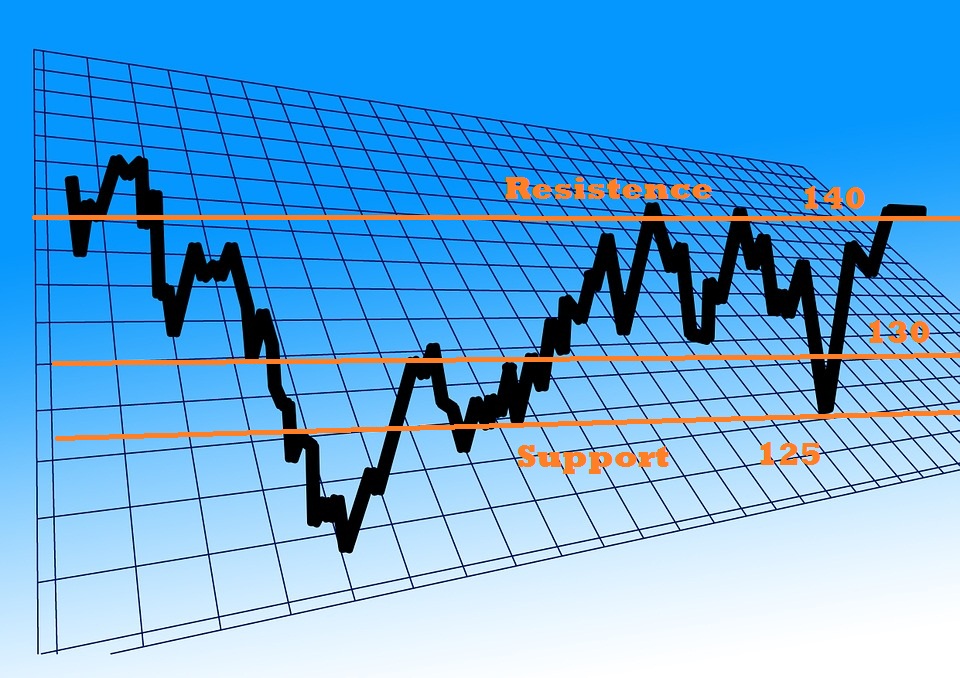
An important part of Technical analysis of stocks is to follow the support and resistance which are directly related to supply and demand. Let’s illustrate this with an example. There is a stock costing Rs. 100 per share. Now the price will uniformly move upwards and downwards frequently. It is seen that it does not come down below Rs. 90/- per share and upwards it keeps its movements. So Rs. 90/- per share is the respective stock’s support level. Again the price of the same stock moves around Rs. 100/- per share and tends to move downward direction. So we can conclude that Rs. 100/- per share is its strong resistance.
After one month or two month or more when it breaks the immediate resistance of Rs.100/- per share and rallies to Rs.130/- per share, it does not trade below Rs. 125/-per share further. Then it movedownward when it reaches Rs. 140/-per share. So the stock’s new support becomes Rs.125 per share and then the new immediate resistance changes to Rs. 140/-per share. In this way you can calculate the stock’s support and resistance point.
Caution to take
You have to be cautious about price movement of the stocks. So while trading you need to set a stop loss to counter any price movement in downward direction to minimize your loss while trading. Suppose a stock has a support at Rs.90/- per share that means it never goes below this price. If by chance it goes below this it immediately recovers its value from that point. Now you can fix a stop loss point at Rs.90/- or Rs.95/-, so on any declining movement you can minimize the loss.
So, this was the detailed discussion on how to make technical analysis of a stock or a company. Generally a stock possesses these features. By following these steps you can easily understand a stock’s nature and its movements. Then you can invest in that stock and make profit.
Do you have any questions about Technical analysis of stocks? Please leave a comment and if you loved the post then like and share.